Graphing CSV data from Mind Monitor in Microsoft Excel
Automatically create beautiful graphs of your brain waves in one click.
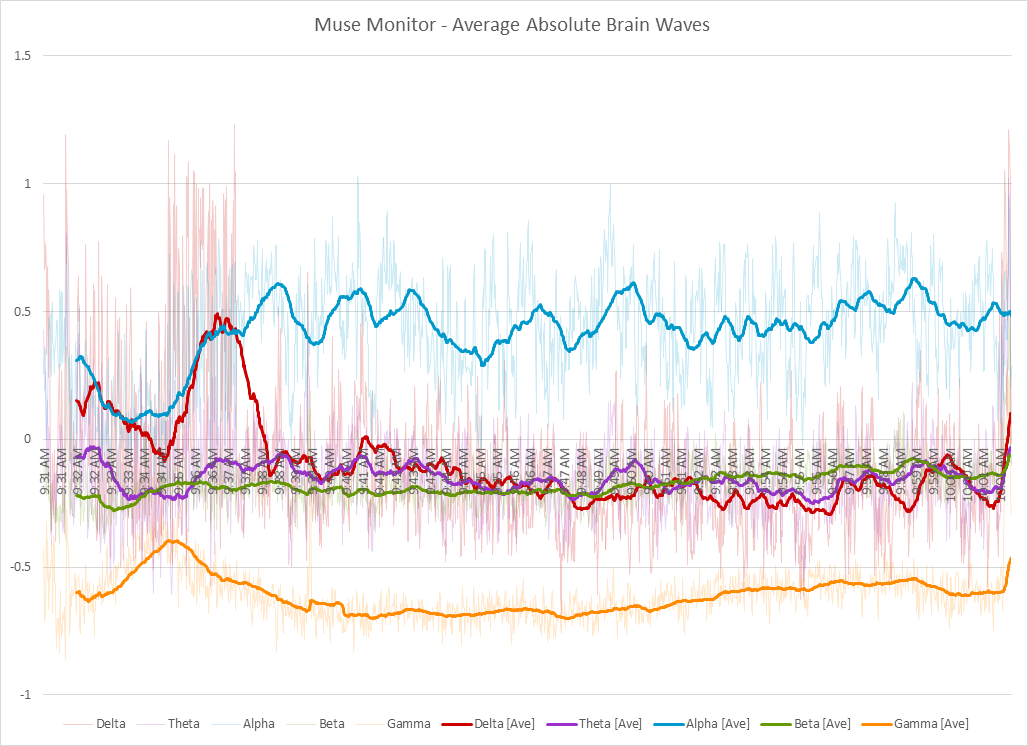
Automatically create beautiful graphs of your brain waves in one click.

Press the play button below, to view the macro code installation instruction video.
Note that on older versions of Excel, you may find the Macro section under the Tools menu.
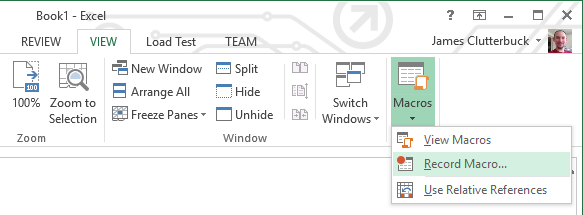
In Excel click View on the ribbon bar.
Click the down arrow under the Macros button and select Record Macro.
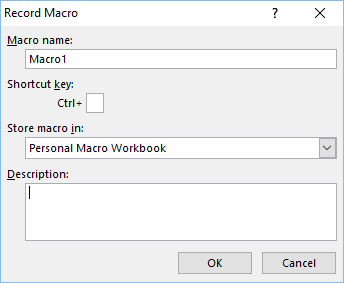
Under Store macro in: select Personal Macro Workbook.
Click OK.
This will now setup your Personal Macro Workbook (if not already done) and create a new macro.
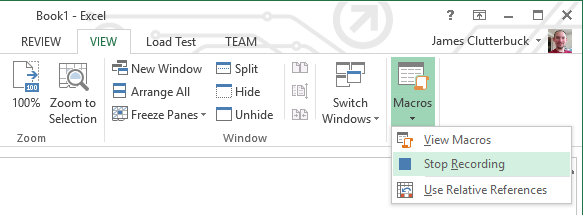
Click the down arrow under the Macros button and select Stop Recording.
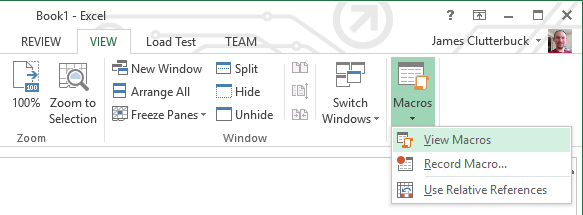
Click the down arrow under the Macros button and select View Macros.
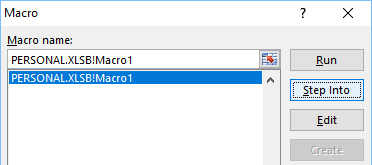
Select the macro you just created (Likely Macro1) and click Step Into.
Note that you can also try clicking Edit to get to the Macro code, however this may result in an error message about your Personal Macro Workbook being hidden. Using the Step Into button bypasses this complexity.
Click the blue stop button in the toolbar.

Below is the macro code you will need, copy it into the clipboard using the COPY CODE TO CLIPBOARD button, or press the SHOW/HIDE CODE button and manually select then copy it.
Sub graphMuseData()
    '---Settings---
    graphLeftRightCoherence = False 'True: Graph Average(left sensors) minus Average(right sensors), False: Graph brain wave values

    averageTrendline = True 'Adds a moving average trendline
    averageTrendlinePeriod = 60
    addTimeBase = True 'Adds the time (Excel does not support date and time) to the graph axis

    graphElements = True 'Show labels for marker elements e.g. /muse/elements/jaw_clench
    showTimeInLabel = True
    ignoreBlinks = True 'Do not put blink markers on the graph
    ignoreJawClench = False 'Do not put jaw_clench markers on the graph
    showHeadbandStatus = True 'Show label markers when the headband looses good fit
    headbandStatusLimit = 4 'Range to trigger bad fit label marker at. 2=OK(not good) data,(3 not used),4=Bad data
    showHeadbandOnOff = True 'Show label markers when the headband is removed
    OldExcel = False 'Enable for older versions of Excel (e.g. 2003, Excel for Mac)

    '---Graphing Code---
    If graphLeftRightCoherence Then
        SheetNamePostFix = "LR"
    Else
        SheetNamePostFix = "Ave"
    End If

    'Remove existing graph if re-running script
    On Error Resume Next
    Application.DisplayAlerts = False
    Sheets("Graph" & SheetNamePostFix).Delete
    Sheets("GraphingData" & SheetNamePostFix).Delete
    Application.DisplayAlerts = True
    On Error GoTo 0

    'Select last sheet (should be data)
    Sheets(Sheets.Count).Select

    headbandStatusGood = True
    headbandOn = True
    numRows = 0

    colDelta_TP9 = 0
    colHeadBandOn = 0
    colHSI_TP9 = 0
    colElements = 0
    colLast = 0

    While Cells(1, colLast + 1).Value <> ""
        colLast = colLast + 1
        If Cells(1, colLast).Value = "Delta_TP9" Then colDelta_TP9 = colLast
        If Cells(1, colLast).Value = "HeadBandOn" Then colHeadBandOn = colLast
        If Cells(1, colLast).Value = "HSI_TP9" Then colHSI_TP9 = colLast
        If Cells(1, colLast).Value = "Elements" Then colElements = colLast
    Wend

    ReDim elementArray(1, 0)

    While Cells(numRows + 1, 1).Value <> ""
        numRows = numRows + 1
    Wend

    If numRows < averageTrendlinePeriod Then
        averageTrendline = False 'Not enough data for trendline
    End If

    dataSheet = ActiveSheet.Name

    Columns("A:A").Select
    Selection.NumberFormat = "hh:mm:ss.000"

    Cells.Select
    Selection.Copy

    Range("A1").Select

    Sheets.Add
    ActiveSheet.Name = "GraphingData" & SheetNamePostFix
    Dim GraphingDataSheet As Object
    Set GraphingDataSheet = ActiveSheet

    Range("A1").Select
    ActiveSheet.Paste

    Columns("A:A").Select
    Selection.NumberFormat = "hh:mm:ss.000"

    deletedRows = 0
    For x = 1 To numRows
        If Cells(x, 1) = "" Then x = numRows

        'Replace errors (-inf,#Name?)
        If IsError(Cells(x, colDelta_TP9)) Then
            Cells(x, colDelta_TP9) = "Error"
        End If

        While Cells(x, 1) <> "" And Cells(x, colDelta_TP9) = ""
            If x > 1 And Cells(x, colElements).Value <> "" Then
                ReDim Preserve elementArray(1, UBound(elementArray, 2) + 1)
                elementArray(0, UBound(elementArray, 2)) = x - 1 'Do not include header row
                elementArray(1, UBound(elementArray, 2)) = Cells(x, colElements).Value
            End If
            Rows(x & ":" & x).Select
            Selection.Delete Shift:=xlUp
            deletedRows = deletedRows + 1
            'Replace errors (-inf,#Name?)
            If IsError(Cells(x, colDelta_TP9)) Then
                Cells(x, colDelta_TP9) = "Error"
            End If
        Wend
        If (showHeadbandStatus Or showHeadbandOnOff) And x > 1 And Cells(x, colDelta_TP9) <> "" Then
            thisStateGood = True
            thisHeadbandOn = True
            If Cells(x, colHeadBandOn) <> 1 Then
                thisHeadbandOn = False
                thisStateGood = False
            End If
            For sensorX = 0 To 3 'TP9 to TP10
                If Cells(x, colHSI_TP9 + sensorX) >= headbandStatusLimit Then thisStateGood = False
            Next
            elementText = ""
            If showHeadbandStatus And (headbandStatusGood <> thisStateGood) Then
                If thisStateGood Then
                    elementText = "Good fit"
                Else
                    elementText = "Bad fit"
                End If
            End If
            If showHeadbandOnOff And (headbandOn <> thisHeadbandOn) Then
                If thisHeadbandOn Then
                    elementText = "Headband On"
                Else
                    elementText = "Headband Off"
                End If
            End If
            If elementText <> "" Then
                ReDim Preserve elementArray(1, UBound(elementArray, 2) + 1)
                elementArray(0, UBound(elementArray, 2)) = x
                elementArray(1, UBound(elementArray, 2)) = elementText
            End If
            headbandStatusGood = thisStateGood
            headbandOn = thisHeadbandOn
        End If
    Next
    numRows = numRows - deletedRows

    If addTimeBase Then
        Cells(1, colElements).Value = "TimeStamp"
        For r = 2 To numRows
            Cells(r, colElements).Value = "=time(hour(A" & r & "),minute(A" & r & "),second(A" & r & "))"
        Next
    End If

    Cells(1, colLast + 1).Value = "Delta"
    Cells(1, colLast + 2).Value = "Theta"
    Cells(1, colLast + 3).Value = "Alpha"
    Cells(1, colLast + 4).Value = "Beta"
    Cells(1, colLast + 5).Value = "Gamma"

    For wave = 0 To 4
        For r = 2 To numRows
            ColTP9 = Chr(64 + wave + 2 + (wave * 3))
            ColAF7 = Chr(64 + wave + 2 + (wave * 3) + 1)
            ColAF8 = Chr(64 + wave + 2 + (wave * 3) + 2)
            ColTP10 = Chr(64 + wave + 2 + (wave * 3) + 3)
            If graphLeftRightCoherence Then
                Cells(r, wave + colLast + 1).Value = "=Average(" & ColTP9 & r & ":" & ColAF7 & r & ")-Average(" & ColAF8 & r & ":" & ColTP10 & r & ")"
            Else
                Cells(r, wave + colLast + 1).Value = "=Average(" & ColTP9 & r & ":" & ColTP10 & r & ")"
            End If
        Next
    Next

    Range("A1").Select
    If addTimeBase Then
        Range(Cells(1, colLast), Cells(numRows, colLast + 5)).Select
    Else
        Range(Cells(1, colLast + 1), Cells(numRows, colLast + 5)).Select
    End If

    If OldExcel Then
        Charts.Add
        ActiveChart.ChartType = xlLine
        ActiveChart.HasTitle = True
        ActiveChart.Legend.Position = xlBottom
    Else
        'NOTE: If you see an error here and are using an older
        ' versions of Excel (e.g. 2003, Excel for Mac), then
        ' change "OldExcel" to True in the settings at the
        ' start of this macro.
        ActiveSheet.Shapes.AddChart2(227, xlLine).Select
    End If

    If addTimeBase Then
        ActiveChart.SetSourceData Source:=GraphingDataSheet.Range(Cells(1, colLast), Cells(numRows, colLast + 5))
    Else
        ActiveChart.SetSourceData Source:=GraphingDataSheet.Range(Cells(1, colLast + 1), Cells(numRows, colLast + 5))
    End If
    ActiveChart.Location Where:=xlLocationAsNewSheet
    ActiveSheet.Name = "Graph" & SheetNamePostFix

    If graphLeftRightCoherence Then
        ActiveChart.ChartTitle.Text = "Mind Monitor - Left Right Brain Wave Coherence"
    Else
        ActiveChart.ChartTitle.Text = "Mind Monitor - Average Absolute Brain Waves"
    End If
    If OldExcel Then
        waveColors = Array(3, 21, 23, 10, 46, 38, 39, 37, 43, 40)
    Else
        waveColors = Array(RGB(204, 0, 0), RGB(153, 51, 204), RGB(0, 153, 204), RGB(102, 153, 0), RGB(255, 138, 0))
    End If
    For x = 1 To 5
        If OldExcel Then
            With ActiveChart.SeriesCollection(x).Border
                .ColorIndex = waveColors(x - 1 + 5)
                .Weight = xlHairline
            End With
        Else
            With ActiveChart.SeriesCollection(x).Format.Line
                .Weight = 1
                .ForeColor.RGB = waveColors(x - 1)
                If averageTrendline Then .Transparency = 0.8
            End With
        End If
        If averageTrendline Then
            With ActiveChart.SeriesCollection(x)
                .Trendlines.Add
                .Trendlines(1).Name = .Name & " [Ave]"
                .Trendlines(1).Type = xlMovingAvg
                .Trendlines(1).Period = averageTrendlinePeriod

                If OldExcel Then
                    .Trendlines(1).Border.ColorIndex = waveColors(x - 1)
                Else
                    .Trendlines(1).Format.Line.Weight = 2
                    .Trendlines(1).Format.Line.DashStyle = msoLineSolid
                    .Trendlines(1).Format.Line.ForeColor.RGB = waveColors(x - 1)
                End If

            End With
        End If
    Next
    If graphElements Then
        labelTopStart = 30
        labelTopIncrement = 15
        labelTopMax = 200
        labelTop = labelTopStart
        hasLabels = False
        For x = 1 To UBound(elementArray, 2)
            datapoint = elementArray(0, x)
            elementText = elementArray(1, x)
            If Left(elementText, 15) = "/muse/elements/" Then elementText = Right(elementText, Len(elementText) - 15)
            If Left(elementText, 1) = "/" Then elementText = Right(elementText, Len(elementText) - 1)
            If (Not (ignoreBlinks And elementText = "blink") And Not (ignoreJawClench And elementText = "jaw_clench")) Then
                hasLabels = True
                If datapoint > ActiveChart.SeriesCollection(1).Points.Count Then
                    datapoint = datapoint - 1 'Last point, render it back one to fit on graph
                End If
                If showTimeInLabel Then
                    elementText = elementText & " - " & Format(Sheets("GraphingData" & SheetNamePostFix).Cells(elementArray(0, x), 1), "h:nn AMPM")
                End If
                ActiveChart.SeriesCollection(1).Points(datapoint).Select
                If OldExcel Then
                    ActiveChart.SeriesCollection(1).Points(datapoint).ApplyDataLabels
                    ActiveChart.SeriesCollection(1).Points(datapoint).DataLabel.Characters.Text = elementText
                Else
                    Dim AC: Set AC = ActiveChart: AC.SetElement (msoElementDataLabelCallout) 'Trick to prevent compile error with OldExcel
                    ActiveChart.SeriesCollection(1).DataLabels(datapoint).Format.TextFrame2.TextRange = elementText
                End If
            End If
        Next

        If OldExcel And hasLabels Then
            With ActiveChart.SeriesCollection(1).DataLabels
                .Border.LineStyle = xlAutomatic
                .Interior.ColorIndex = 2
            End With
        End If

        For doubleLoop = 1 To 2 'Excel bug does not set all heights on first try
            labelTop = labelTopStart
            For datapoint = 1 To ActiveChart.SeriesCollection(1).Points.Count
                If ActiveChart.SeriesCollection(1).Points(datapoint).HasDataLabel Then
                    ActiveChart.SeriesCollection(1).Points(datapoint).DataLabel.Top = labelTop
                    labelTop = labelTop + labelTopIncrement
                    If labelTop > labelTopMax Then labelTop = labelTopStart
                End If
            Next
        Next
    End If

    ActiveChart.ChartArea.Select
End Sub
You can now replace the code in macro you just created. Select all the code and Paste over with the code you copied from above.
Save and Close the macro editor.
You can now open a Mind Monitor CSV file and run your macro from the Macros menu to create a graph, however as an optional extra step, you can put a button on your Excel menu to run the script with one easy click.
Right click the ribbon bar and click Customize the ribbon

Select the View menu tab in the right section and press New Group, then Rename.
Enter a Display name for your group, for example "My Macros" and press OK.
On the left column drop down Choose commands from select Macros.
Click PERSONAL.XLSB!graphMuseData and press Add >> to add it to your My Macros group.
Select PERSONAL.XLSB!graphMuseData on the right and press Rename.
Enter a name for you button such as "Muse Graph", pick an icon and press OK, then OK
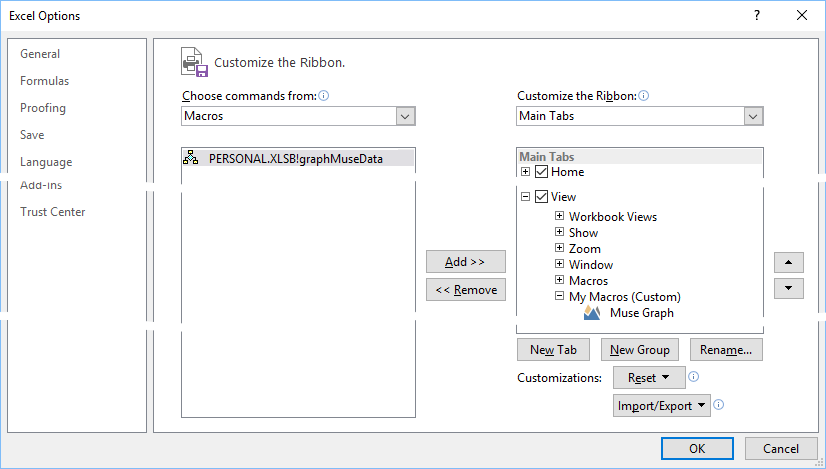
Your custom Muse Graph macro button is now ready to use on any Mind Monitor CSV file you open .
